Memoir submitted to MRC Memphrémagog during the period of Public Consultation on the MRC’s Management Plan (Plan de gestion) for a part of North Hatley’s flood zone
Good evening
I thank the Prefect for allowing me extra time to make my presentation. I am Michael Grayson, a civil engineer and environmentalist, and I’ve lived in North Hatley since 2002.
I’ll begin by showing you blown-up portions of two maps, each of which set out to show flood zones as they apply to the study zone: the proposed development site. The two maps paint very different portraits of the same subject.
- The first map was produced in late 2012 for the municipality by land surveyors Ouellet, Couture (Ecce Terra) and signed February, 2013. See Map #1 in Appendix 1
The Town asked them to make a topographical map covering all flood zones in North Hatley, and to trace on that map the contours corresponding to 20 and 100 year flood levels of the lake. These levels (162.16 and 162.56 m above sea-level) are obtained statistically from data provided by the Environment Ministry.
(In my presentation, I shall use this shortened title for the Ministry of Sustainable Development, Environment and Action against Climate Change).
- The second map, produced by consulting firm EXP, was delivered to the Town a few months later. It is the map adopted in 2015 as the MRC’s revised flood zone map for North Hatley : Map #A2-7a. See Map #2
It is the product of a simulation of the river’s profile corresponding to different periods of flood recurrence. It assumes that water levels in the study zone are directly related to river levels in all flood events.
Areas shaded in red show the extent of flooding, due to a 20 year event. In a 100 year event, water will in addition cover the areas shown in yellow.
Comparison of the two maps reveals striking differences: far more terrain is flooded according to the first map. How can these differences be explained?
Two factors are largely responsible.
- The first results from two different ways of interpreting the cause of flooding in the study zone.
- In their 2013 analysis, EXP sees the river as the sole cause of all flood events affecting this land.
It is paradoxical that EXP states in their report that “Land bordering the river (Riverside Park) is higher than the development zone, and therefore in theory should prevent flood waters reaching the zone”. They nonetheless produce a map showing extensive flooding in this zone.
- The surveyors’ map shows the situation when the lake overflows directly onto the development zone. It relates flood events directly to the lake.
The river mouth’s capacity is limited by the presence of the road-bridge and the narrow section between the Pilsen Pub on one bank and the stone retaining wall on the other. In major flood events, lake water is forced to rise until it spills over at Dreamland Park.
I’ll come back to this a little later.
- The other factor behind this major difference is incorrect measurements taken in 2013 of the road-bridge at the river mouth.
In responding to my allegation of the error in January 2015 (Public consultation), EXP continued to maintain that the underside of the bridge was 63 cm lower than reality.
This error amplified the strangling effect of the bridge on river flow. The Ministry of Environment has recently acknowledged the need to review the effect of this error on the analysis leading to the flood zone map.
It is interesting to note how closely the first map corresponds to the flood zone map for North Hatley that was in force, until the revised map replaced it in 2015.
We should now return to the two different systems which can cause the zone to flood:
- The river in the case of more frequent events (of less severity).
- The lake in high-water events when the river capacity cannot meet the demand.
- Up to the point when the lake’s level reaches that of Main Street at its lowest point (at the intersection with Capelton Road), the river can be seen as the principal cause of flooding in this zone.
Kezar Stream also contributes some water.
- But, when the lake level rises above that of the road, water starts to flow directly towards the site without passing through the river. The lake becomes the controlling factor for flood levels in the zone.
This kind of event can be predicted to have a recurrence rate of about 25 years, using data from the Environment Ministry.
- The last flooding in this zone coming directly from the lake occurred in 1994.
The next one can be anticipated in the near future. These events usually occur in mid-late April.
The lake level rose to 162.40 m in 1994, as confirmed by EXP, and water was level with the underside of the bridge. See Figure 1 in Appendix 2
At this time, water was crossing Main Street at a depth of 15 – 20 cm. See Figure 2
- In a 100 year event, water crossing the road would be 30 – 35 cm deep.
Depths in the flood zone would be considerably greater due to lower level of the proposed building site.
- Photos of past flood events show turbulent water crossing the road and flowing toward the study zone. Analysis of these photos point to water speeds of at least 10 kmh.
- In 2014, rising waters caused the municipality to place sand-bags along the edge of Main Street at Dreamland Park.
It would be totally unrealistic to think that such a measure could be effective in a higher water event.
- In view of the probable occurrence of more extreme weather events related to climate change, lake levels could reach the road level more frequently, perhaps on a 20 year level of probability.
I would like to emphasise the extent to which the land surveyors’ map represents the reality as observed on this piece of land and on adjacent areas.
- Residents on the east side of Capelton Road testify to the accuracy of flood contours traced by Ecce Terra.
- Photos of the 1994 flood show gas pumps behind the accommodation store (dépanneur) surrounded by 30 – 40 cm of water, which corresponds to what Ecce Terra’s map shows.See Figure 3 in Appendix 2.
In contrast, this area should never flood, according to the MRC’s map, even during 100 year events.
According to the surveyors’ map, water depths will reach 80 – 90 cm around blocks M1 and M2 during 20 – 25 year events, and up to 125 cm in 100 year events.
See Map #3 for the proposed location of residential blocks in the flood zone.
These depths are 50 to 60 cm greater than those indicated in the study leading to the MRC’s map. These differences correspond perfectly with the error made in measuring the vertical clearance of the bridge.
When the lake is seen as the direct cause of serious floods on the site, Table 3 on page 25 of the Plan de gestion loses its credibility. It shows 46% of sector M1 and 39% of sector M2 as being in a high current flood zone (0 – 20 years). In reality, M1 would be entirely in the 20 year zone and M2 almost entirely.
As for the proposed mixed commercial and residential sector C1, at least half of this area is within a high current flood zone, and the remainder in a low current zone (20 – 100 years). Water will reach depths of 40 – 50 cm in 20 year events and close to one metre in 100 year events.
(This is in sharp contrast to the MRC’s assertion that this is at all times a dry zone).
Role of the study zone
I’d like to briefly refer to the important role which this low-lying corridor has played, from time to time over recent decades, as an overflow channel for the lake. It was formerly part of a wider wetland at the toe of the lake, between Capelton Road and the river. Figure 4 shows how floods covered this whole area, until landfill (including town waste) raised the land east of the railway to create what is now Riverside Park. This forced flood water into a narrower channel through the study zone, before it can return to the wider stretch of river beyond the park.
The lowest part of the study zone should not be obstructed. It must continue to act as a sort of spillway for the lake, just as it did until 2002. It was then that the municipality blocked this channel by constructing the east-west arm of the parking area, without the requisite authorisation of the Environment Ministry. There has not been a major flood event since 1994 … the next one is likely to happen in the near future.
The relocation and opening up of the Kezar Stream, as required by the Ministry, will necessitate making a passage through this “dam”, which will permit the free flow of floodwater to occur during future high-water events.
Conclusion
All the foregoing factors lead me to question the pertinence of today’s meeting to discuss a plan which is incomplete and seriously flawed. I must also wonder about the lack of rigour with which government departments appear to have treated this dossier.
Even supposing that the MRC’s map is valid, I’m amazed at the effort being made to justify construction in these high current flood areas. Why should we run these kinds of risk to build on land where permits have been refused for many years?
When the necessary corrections are made to the flood zone map, then construction as proposed should become unthinkable.
Michael Grayson, eng.
April 13, 2017
APPENDIX 1 : Maps #1 – 3
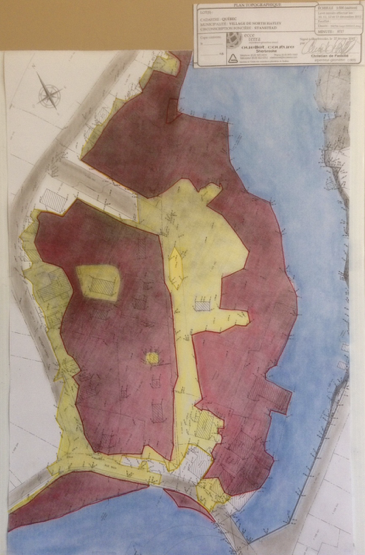
Map #1: Extract from topographical map, by Ecce Terra land-surveyors
Produced for the municipality of North HatleyFebruary 2013
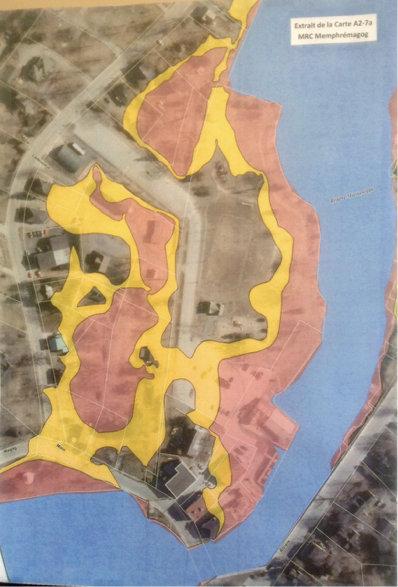
Map #2: Extract from the Map A2-7a, Schéma d’aménagement, MRC Memphrémagog
Produced by Les Services EXP for the municipality of North Hatley June 2013
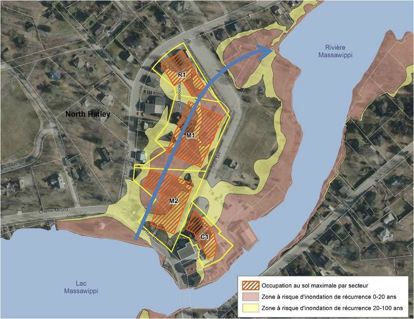
Map #3: Proposed building plan in the flood zone
M1, M2 and R1 offer a total of 210 residential units (condos)
M2 : 5 floors M1 and R1 : 4 floors
This corridor acts as an overflow channel for the lake, during events where lake levels rise above the road-level. Progressive filling of the eastern part of this large former wetland area has forced flood waters to flow with greater force through the study zone, during such high water events. The blue arrow indicates schematically the path which water follows before returning to the river where it widens.
APPENDIX 2 : Figures 1 – 4
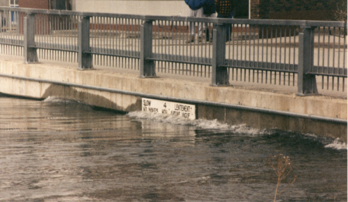
FIGURE 1: Water touching the underside of the road-bridge April 18, 1994.
The bridge was closed to traffic as a precaution.
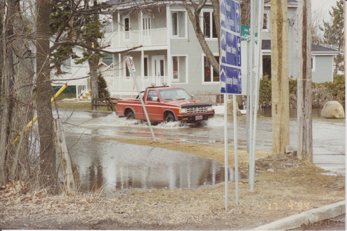
FIGURE 2: Intersection of Capelton and Main April 17, 1994.
Water flowing across the road, and then flowing through the study zone.
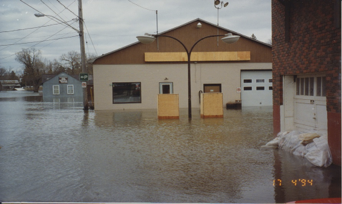
FIGURE 3: Gas pumps behind the accommodation store April 17, 1994
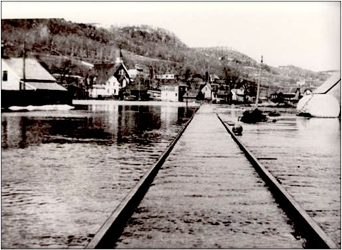
FIGURE 4: Flood event during the 1930s
Looking northwards, with the proposed building site on the left side of the former railway. Filling of the area to the right, now Riverside Park, means that flood-water will periodically flow with greater force through the low-lying land which is slated for development.
The opinions expressed on this website are those of their authors. Space on the website is provided as a service to the community and FANHCA, its administrators and host cannot be held responsible for any of the opinions expressed thereon.